Converting RWS Waterinfo data to (normalized) SQL
On this page I will describe the tool that I made to create SQL files from Rijkswaterstaat Waterinfo datasets. You can find the project itself on GitHub here.
The dataset
The datasets for which this tool is created, are from Rijkswaterstaat (the Dutch Ministry of Infrastructure and Water Management). Historical measurements can be requested on their website Waterinfo. I had already used this data in the past for several small projects for courses at my university (such as Data Analysis & Vizualization Techniques). During these projects, I had to use the data in an SQL database, which required a bit more work than simply importing the CSV file, due to special characters being used in some of the column names, as well as commas being used as a decimal separator.
When you have requested data from the Waterinfo website, a single CSV file gets sent to you. This CSV file contains rows for every measurement, with the data having 50 columns, most of which metadata that was often not used in the dataset. This made me wonder about how much space could potentially be saved when this metadata (which would often be either missing or always the same for a particular location/measurement type) would be saved in separate tables.
Normalization
The plan was to put columns that are related to each other into a separate table. For example, the following columns are all related to the measurement's location: location name, location code, x, y & epsg (the EPSG value defining the coordinate system that is used for the x & y columns). This means that, for every location where measurements are made, these 5 columns will always have the same values. By moving these columns to a separate table, and adding a foreign key column to the measurements table, instead of having to define the name, code, coordinates & coordinate system for each measurements, this data instead is only defined once in the separate table, and this separate data is referenced in the foreign key column in the measurements table.
Similarly, metadata about chemical parameters and data about measuring devices will both have a separate table too. Furthermore, there are many columns which are a combination of a name and a corresponding code. These can also be put into separate tables
Finally, as mentioned earlier, many of the columns are exclusively used for chemical data, and even in many of the datasets I tested with chemical data, there were still some columns that were not used at all. Therefore, there should be the option to remove these columns entirely
Writing the Python scripts
For the Python scripts, the plan was: ask the user for the CSV file, turn it into a pandas (Python library for data analysis) dataframe, ask the user if normalization and removing unused columns is desired, then adjusting the data based on the user's choices, and then writing the SQL file.
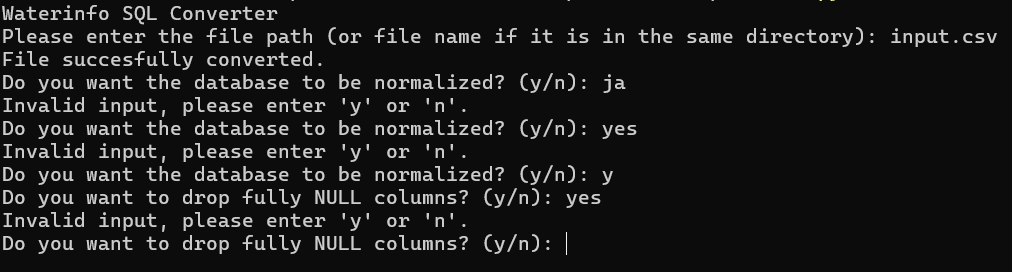
A big change when I was working on the scripts was that at first, the user would be asked after starting the script to enter the filename, then if normalization and removing unused columns was needed. You can see this original approach in the above screenshot. The problem with this was, either I had to cover all cases for how the user would enter their response (y, yes, Y, Yes. Also j or Ja considering many users would be Dutch speakers), and keep looping until a valid response was given (which would look messy both on screen and in the code).
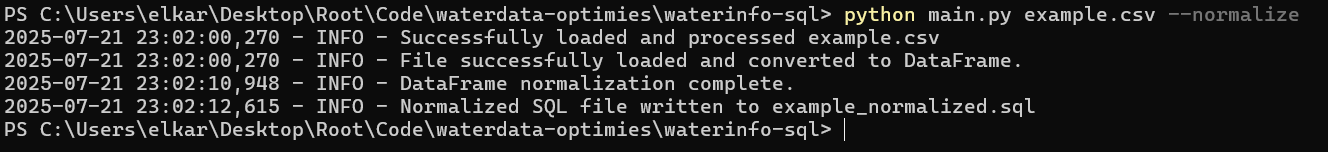
At first I explored if it would be possible to have the user navigate through options using the arrow keys, and using spacebar to check options, as seen in some command line installation programs. However, I ended up using argparse, which sees uses entering arguments while starting the script in the command line. You can see this in the above screenshot: the filename is entered, while flags are used for normalization and removing columns can be optionally toggled as well.
Testing the output

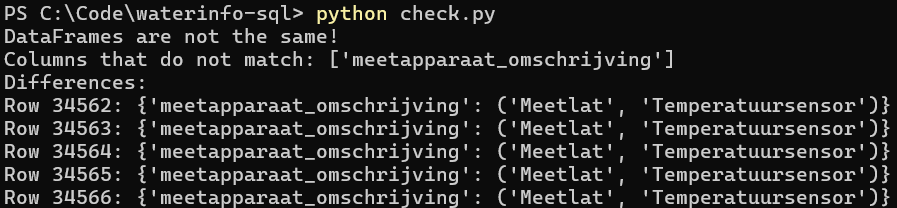
Aside from testing out various SQL queries and testing all 3 options (no normalization, normalization & normalization with empty columns removed) on various datasets, I also wanted to ensure no data was lost in the normalization process. For this I wrote a script to import two SQLite databases: one which has the normalized SQL, and one which does not. The Pandas dataframe containing the normalized database is then reconstructed (tables merged and foreign key columns removed). The dataframes are then compared to eachother.
Conclusion
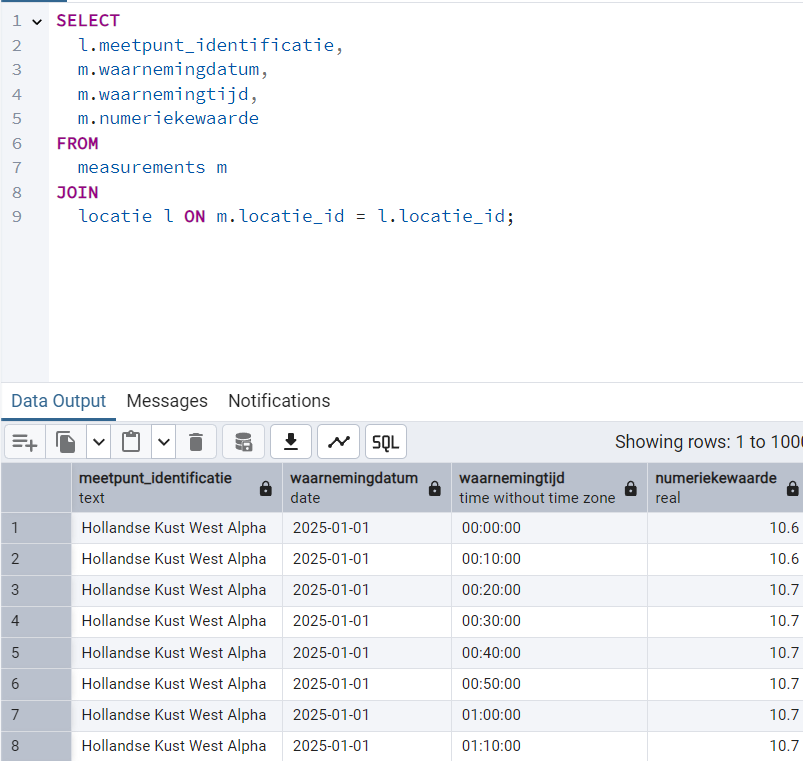
I tried importing the data into both SQLite and PostgreSQL, and it works on both systems. The normalized database looks a lot more structured, and when using a big dataset, it is noticably faster when importing data. Although the SQL files are understandably bigger than the CSV files, the actual database (when using SQLite), depending on the dataset will be around 60-70% smaller.