Visualizing temperature data in VisIt
As part of the Visualization Techniques course at university, I worked with VisIt to visualize and analyze complex scientific data. This software is mainly used for high-performance scientific visualization, and the subject was meant for Physics students, with Computer Science students only having to showcase knowledge of the software by downloading an existing model. However, I challenged myself by converting, and importing a dataset. For this project, I visualized the change in water temperature during the year at different measuring points across the Netherlands, using data from Rijkswaterstaat. Below I describe the approach I took.
Downloading the data
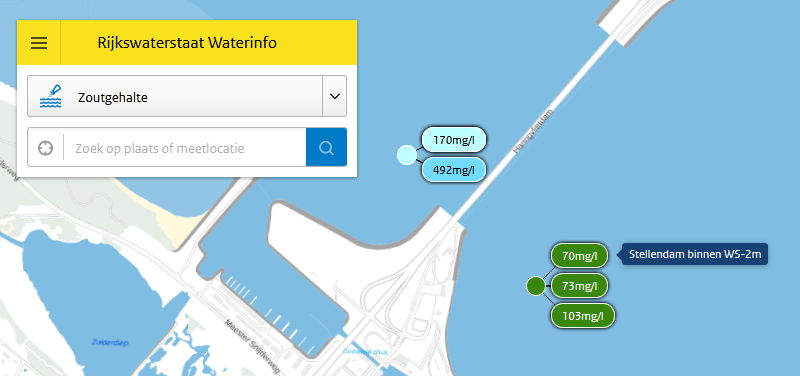
I downloaded the data from Rijkswaterstaat Waterinfo (an official data website from the Dutch Ministry of Infrastructure and Water Management). The website allows for downloading historic data by selecting parameters, measuring locations and time period. Then, the requested dataset gets sent by email. I chose the water temperature parameter, and many of the available locations, with a time period of 1st of January 2023 until 1st of January 2024.
Observing the data
The data sent by Waterinfo is a single .csv file. To be able to analyze the data, I imported the file into a Postgres database. Although pgAdmin (GUI management tool for Postgres) allows for specifying some special characters (such as the delimiter character, quoting character and NULL string character), there was no option to choose the decimal separator sybol. This was a problem, as SQL expects a period symbol as the decimal seperator, but a comma is used in the .csv file. Because of this, I first had to write a simple Python script to replace the commas with periods.
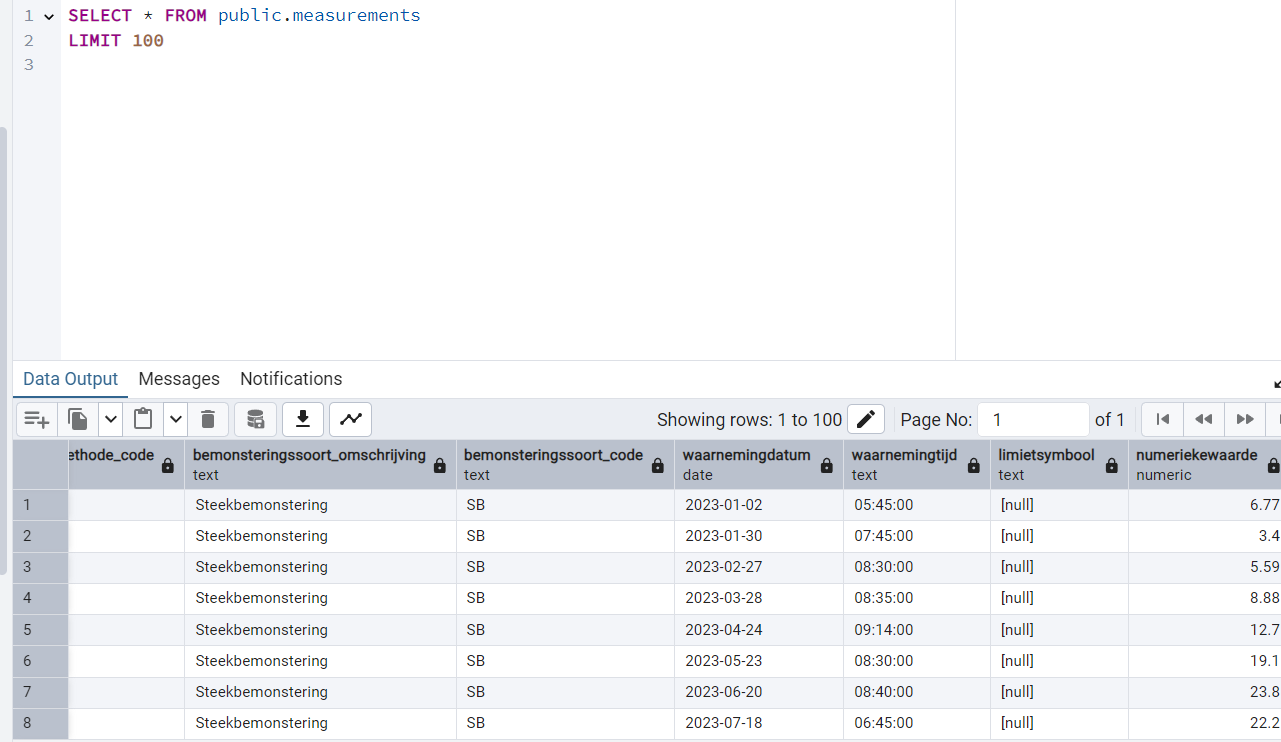
The table contains 50 columns, many of which are null, as they are not used for the simple temperature data I requested. The reason for the columns still being present is the fact you only receive a single .csv file containing all the data, even if you were to select multiple parameters. For this project, the relevant columns were:
- meetpunt_identificatie: Name of the location where the measurement was made
- waarnemingsdatum: The date on which the measurement was made
- waarnemingstijd: The time at which the measurement was made
- numeriekewaarde: The temperature that was measured. (In degrees Celcius, the unit of this value being specified in the eenheid_code column)
- x, y: These columns contain the coordinates of the location at which the measurement was made. This is useful, since we need to visualize the data
Saving the data for use in VisIt
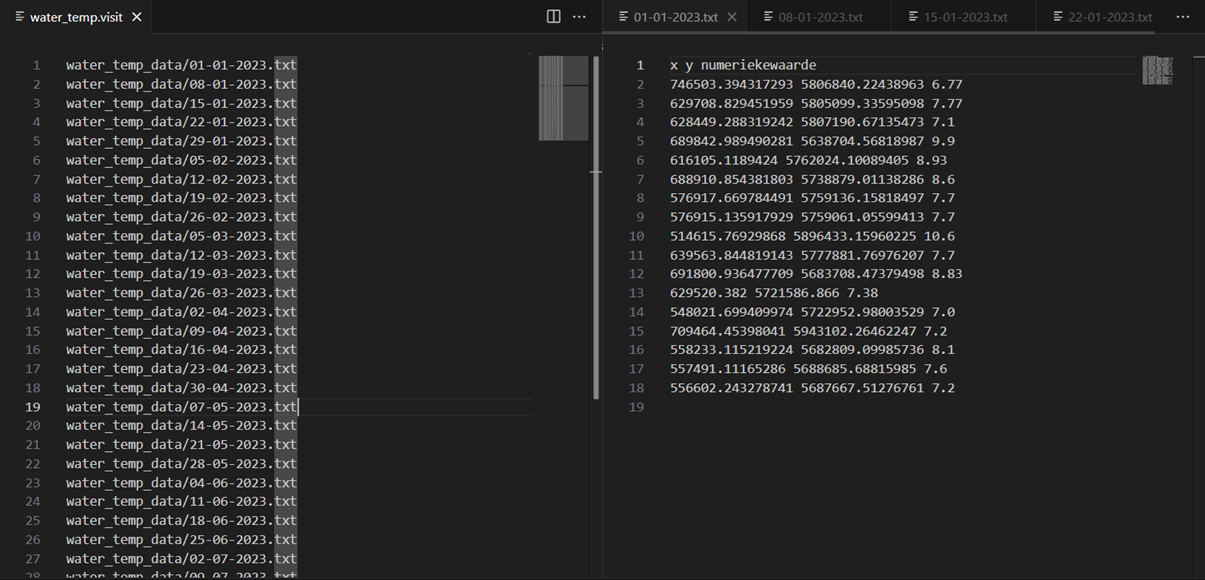
Some of the locations have measurements exactly every 5 minutes, whereas other locations have measurements only made once a day, or in some cases only once a week. Presumably, this is because some stations have sensors for measuring, while other locations have manual measurements. Because of this, I decided to write a script that starts from January 1st, 2023, and, for each week, selects the measurement at each location that is closest to noon on the given day. I then wrote a script that saves the coordinates and measured temperature data into separate text files for each date, along with a .visit file that lists all the text files to be used.
Visualizing the data in VisIt
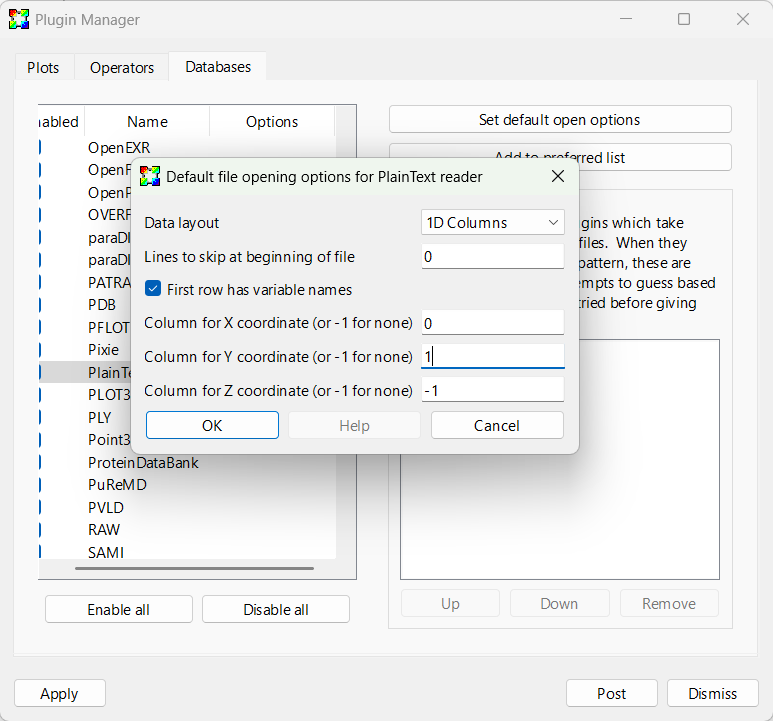
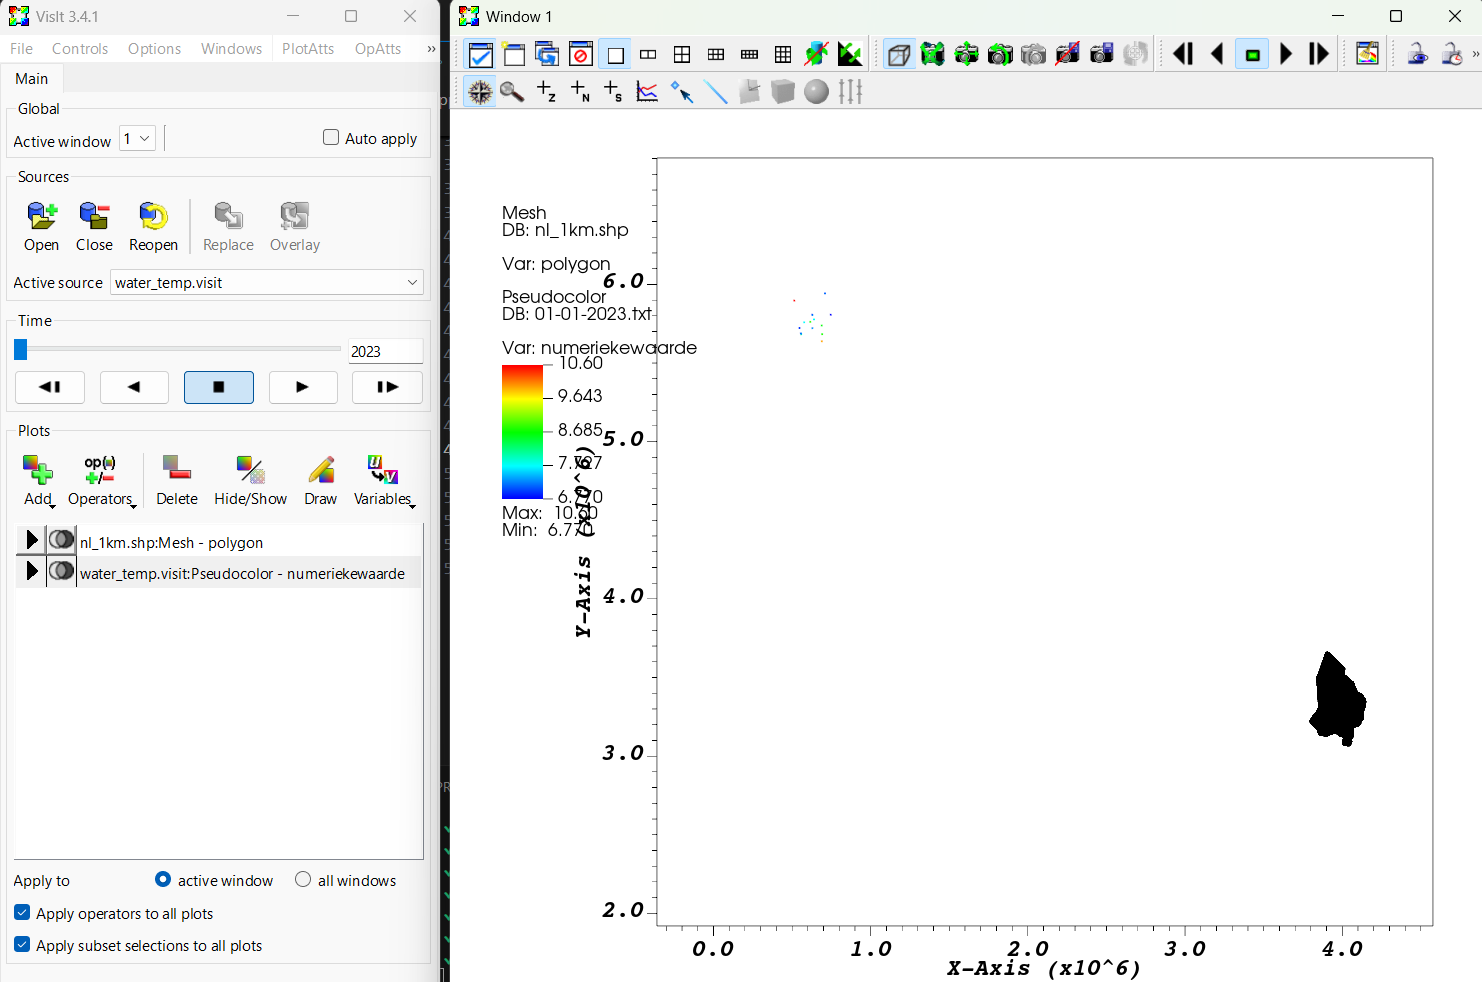
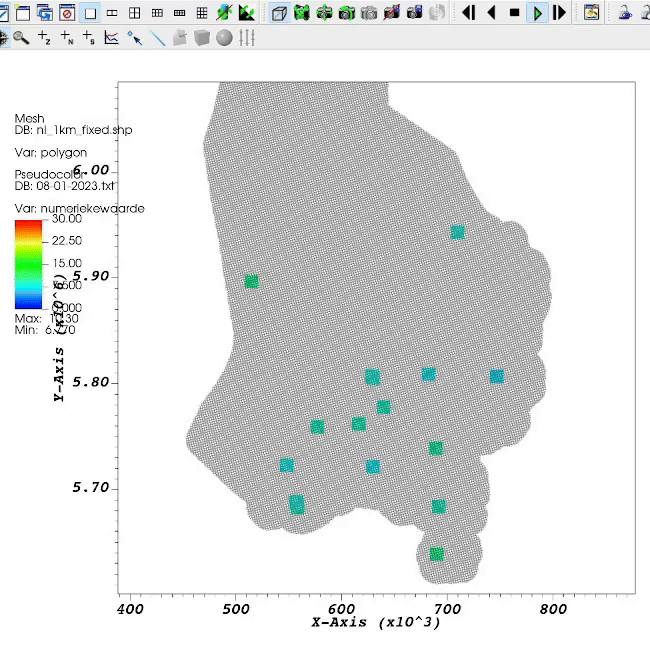
The final step was to display the data in VisIt. For this, I downloaded a shapefile of The Netherlands from the European Environment Agency. Then I set up the PlainText plugin for VisIt, to make the text files work correctly. There was one problem however, as the points where not appearing in the correct location. As it turns out, the shapefile had to be converted to be used with the appropriate coordinate reference system. The dataset had a column for the EPSG (referency system) code, which was 25831 for every measurement. I used the geopandas Python library to convert the shapefile, and now the points where showing correctly. You can see the final result below.
Conclusion
As expected, we can see the temperature rising in the summer months and decreasing again after September (you can see the file in use on the left of the picture). Furthermore, during the summer, the temperature seems to usually be higher in the locations in the east, compared to the locations in the west (closer to the sea).
Although VisIt is definitely not the most appropriate software for this kind of task, it was still interesting to find ways to convert the data to work with this software.